

School-level feature — managed within your school portal at
yourschool.deandesk.com.Video walkthrough
This walkthrough uses the real DeanDesk interface with the fictional Northstar Academy demo school and a calm, AI-generated English voice. Payments and outside services are not connected in the demo.
Choose the attendance mode
In School Configuration → Features → Attendance tracking, admins choose Per course or Per school day. Per-course mode treats each course meeting as an official attendance unit. School-day mode records one official status per eligible student each day, using the school timezone. Historical records are preserved when you change modes. Course-session records and video-call attendance remain useful for individual classes. In school-day mode, use the daily register for official daily attendance rather than treating each class meeting as a separate school day.Daily attendance
1
Open Daily Attendance
Choose a date. Search by student or filter by grade. Admins can manage the register; teachers need Allow teachers to manage daily attendance enabled in school settings.
2
Mark statuses
Choose Present, Tardy, Excused, or Unexcused for each student. Unmarked means no decision has been recorded. Mark shown present and Clear shown affect only the students visible under your current filters.
3
Record minutes late (optional)
When you mark a student Tardy, a min late field appears next to their status. Enter how many minutes late the student arrived, or leave it blank.
4
Save and finalize
Click Save draft to keep work in progress. Once every student is marked, click Finalize day to save and lock the day’s register. The unmarked count includes students outside your current filter.
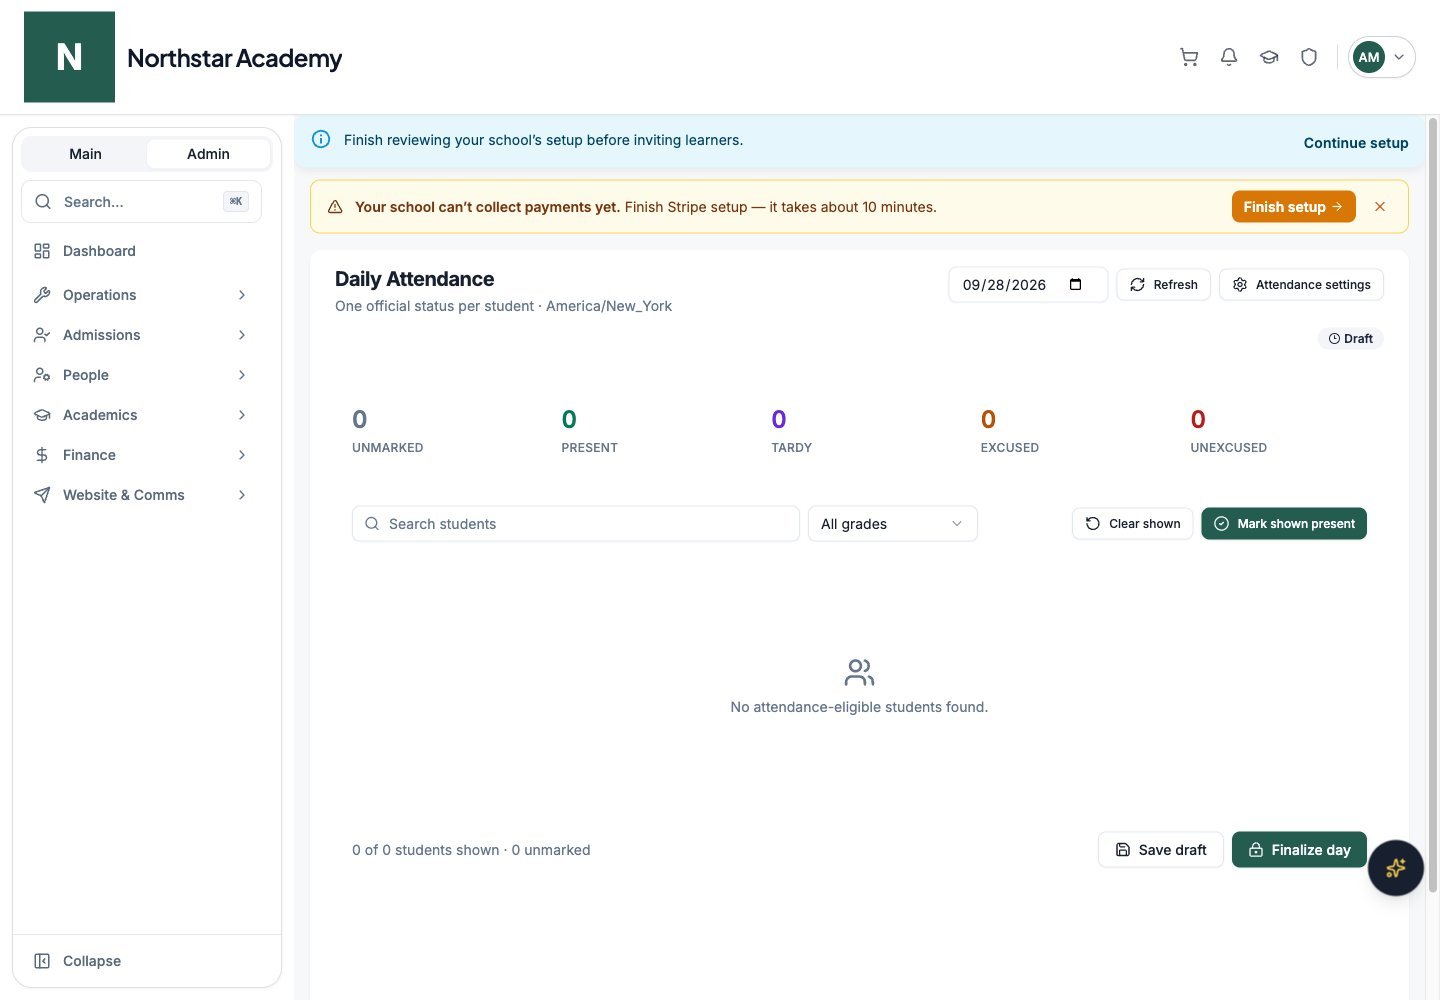
Northstar demo — Daily Attendance
Student check-in
Enable Student self-reported attendance in school settings to let students mark themselves present from the Attendance check-in widget. Depending on your mode, they check in for the current school day or a course session opened for attendance. The widget shows when attendance is already recorded or finalized. This is a present-only check-in; staff manage other statuses and corrections.Attendance by period
Admins use Attendance by Period to see whether attendance has been taken for scheduled classes on a selected date. The page groups classes by period, shows the responsible staff and when records were taken, and provides filters for Attendance taken and Attendance not taken. Search helps locate a class or staff member. The Outside the schedule section shows attendance recorded for classes that were not scheduled that day. Open a class’s attendance link to inspect its register. This page monitors course-session attendance; it does not finalize the daily register.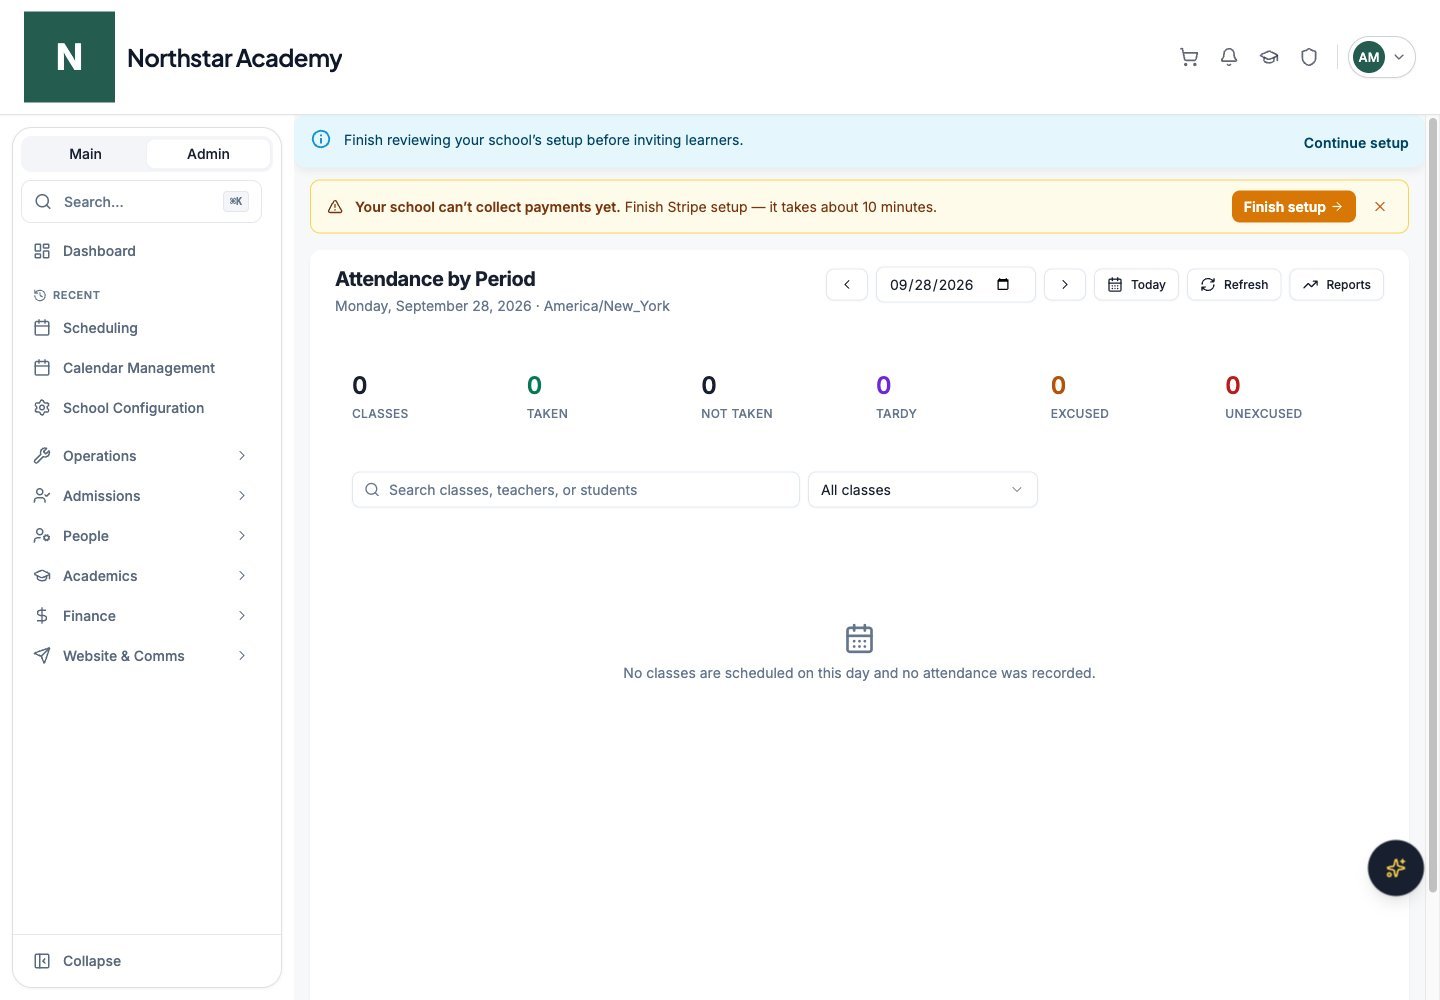
Northstar demo — Attendance by Period
Navigating to the Attendance tab
Open a course and choose Attendance. Select an End date and a range of 7, 14, 30, 60, or 90 days to review summary counts and per-student rates.Marking attendance for a session
1
Open Take attendance
Click Take attendance from the course attendance view. The dialog lists enrolled students.
2
Review and mark statuses
Select Present, Tardy, Excused, or Unexcused for each student. Mark all present and Mark all absent let you set a starting point, then adjust individual students.For a Tardy student, you can enter how many minutes late they arrived in the min late field. The field is optional.In school-day mode, the dialog starts with today’s daily statuses and minutes late where available. These course-session edits do not replace the official daily register.
3
Save attendance
Click Save attendance. Closing the dialog without saving does not record the new session.
Reviewing and correcting history
Click View history to open Attendance History from the course attendance view. It lists dates, students, recorded statuses, and estimated time in call when video-call data is available. Change an individual status to save a correction and refresh the summary. For a Tardy record, edit the min late field and click away from it or press Enter to save. The summary table shows each student’s Present, Tardy, Excused, and Unexcused counts and attendance rate. When minutes late were recorded, the Tardy count also shows the total, for example 3 (25 min). Daily-register edits and course-session corrections are separate operations.How the attendance rate is calculated
The attendance rate counts Tardy as attended:Attendance rate = (Present + Tardy) ÷ total marked sessionsTardy also appears everywhere attendance is summarized — the summary cards and per-student tables, ” present, tardy” session summaries, a Tardy column on the Attendance Reports page, tardy students counted as present in the Admin Dashboard’s Attendance trend card, a Tardy chip in the parent Children Progress widget, and a Tardy column in printed attendance tables.
Because tardy sessions now count toward the attendance rate, percentages may differ from what was previously reported for the same records.
Minutes late
Minutes late is an optional detail on a Tardy status. You can enter a whole number from 1 to 1440 in the web app and the iOS app. If you change a student from Tardy to another status, the minutes late value is removed. Where it was recorded, minutes late appears in:- The daily register, the Take attendance dialog, and Attendance History
- The course summary cards and the per-student summary table, as a total
- Attendance by Period, next to each tardy student’s name
- The parent Children Progress widget, as a total on the Tardy chip
- Course session summaries in the iOS app
Automatic attendance from video calls
If a class meets over a DeanDesk video call, attendance can be recorded automatically from each student’s time in the call — no roll call needed.Ending class and finalizing attendance
Teachers and admins hosting a call see a red End class button next to the Live indicator. Clicking it opens a confirmation dialog — “End class and finalize attendance?” — explaining that the call session will end and student attendance will be calculated from their time in the call. On confirming, the host lands on the course attendance page with the session’s records filled in. Time in call is tracked automatically for all participants throughout the session.How statuses are assigned
Each course’s call sessions follow an attendance policy:- Grace period (default 10 minutes) — students who join after the grace period are marked Tardy.
- Minimum attendance percent (default 75%) — the share of the session a student must be connected to be counted as attending.
- Brief disconnections don’t split attendance — a short drop-off or reconnect doesn’t reset a student’s attended time.
Automatic vs. manual records
Records created from a call are marked with the video-call source, while roll-call entries are marked manual. Teachers can still edit any automatically recorded status — an edited record is marked manually overridden, and the teacher’s edit takes precedence over the automatic calculation.Attendance Reports
While the course Attendance tab is scoped to a single course, administrators can review official attendance across the whole school on the Attendance Reports page.- In per-course mode, go to Admin Dashboard → Operations → Attendance.
- In school-day mode, the Operations menu item is Daily Attendance and opens the daily register instead. Open Attendance by Period and click Reports to reach Attendance Reports.
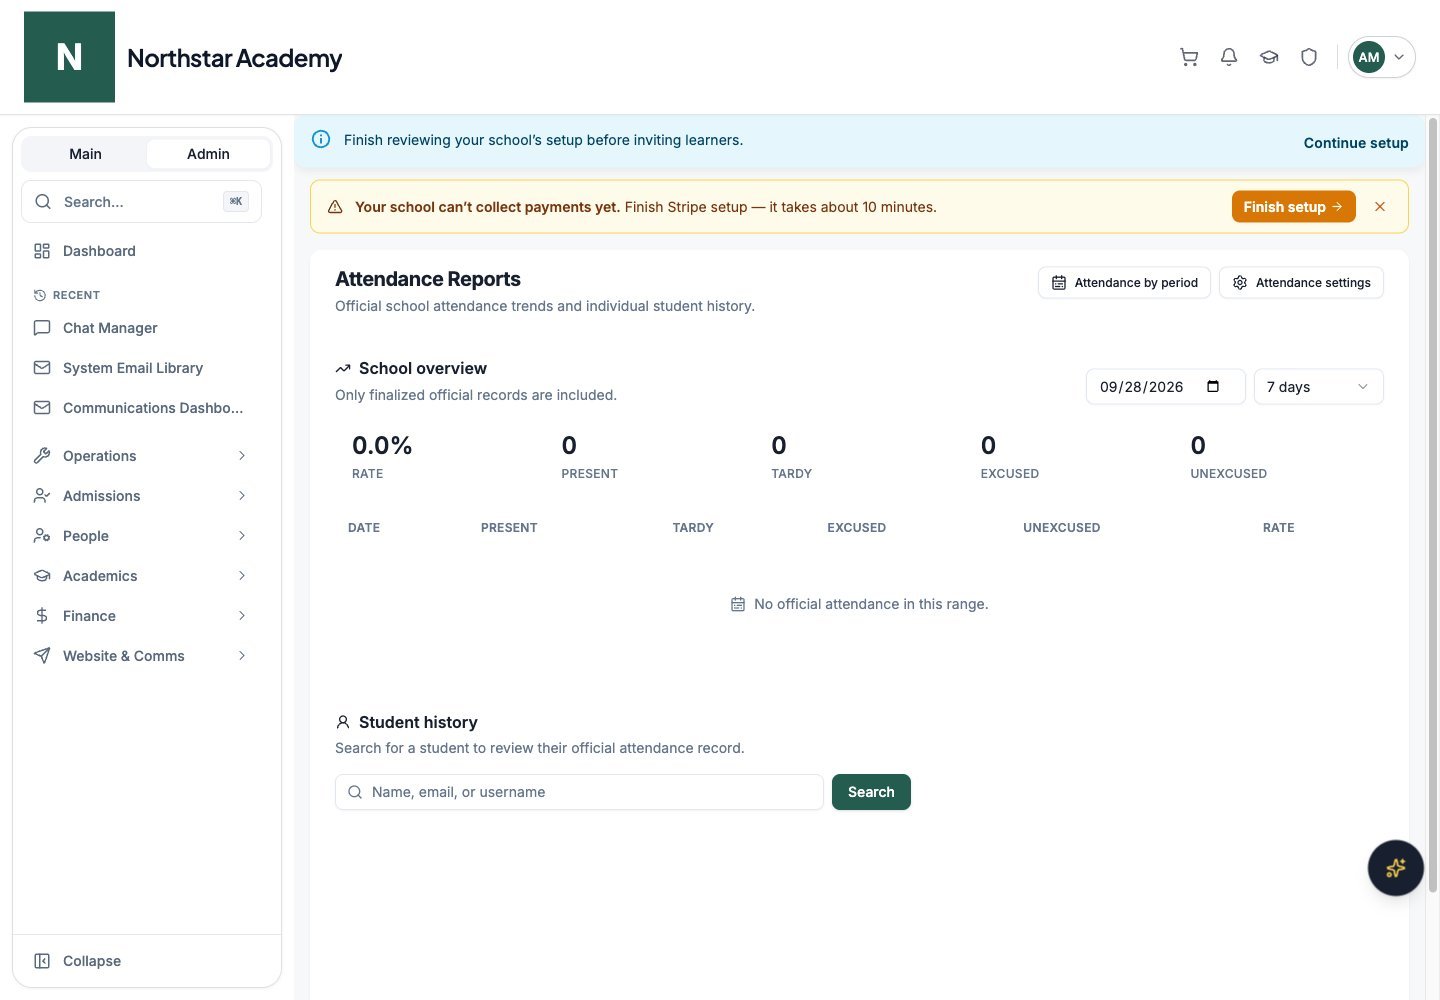
Northstar demo — Attendance Reports
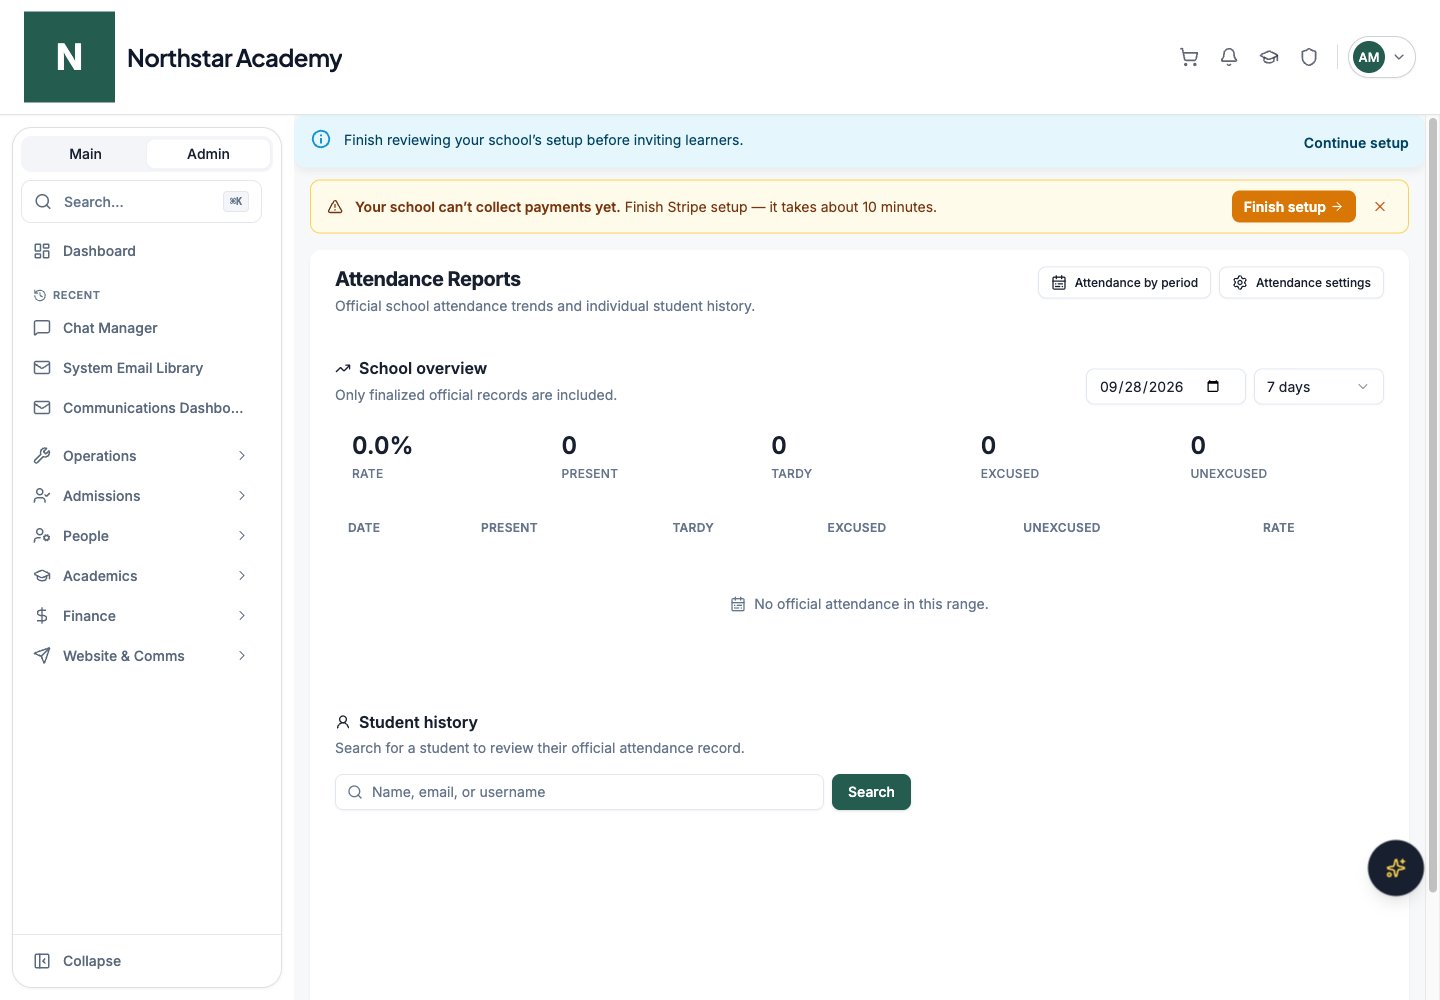
School overview
The School overview section summarizes attendance for all students. Choose an end date and a range of 7, 14, 30, 60, or 90 days from the dropdown. Only finalized official records are included; draft daily registers are left out. The section shows:- Summary figures for Rate, Present, Tardy, Excused, and Unexcused
- A daily table with Date, Present, Tardy, Excused, Unexcused, and Rate columns
Student history
Below the overview, use Student history to review one student’s official attendance record:1
Search for the student
Enter a name, email, or username in the search field and click Search (or press Enter), then select the student from the results.
2
Set the date range
Choose an end date and a range of 7, 14, 30, 60, or 90 days. The range starts at 30 days.
3
Review the results
The page shows the student’s Rate, Present, Tardy, Excused, and Unexcused figures and a daily table with Date, Present, Tardy, Excused, Unexcused, and Rate columns. Click Choose another to look up a different student.
How attendance data flows into reports
Attendance records feed into two downstream areas:- Student reports: Admin-level student reports include attendance summaries per course. Go to Admin Dashboard → Reports → Student Reports to view or export these. See Student Reports for details.
- Student Information System (SIS): Attendance data is accessible in each student’s record under Student Records, giving advisors and administrators a full picture of engagement across all courses.
Best practices for accurate records
- Mark attendance at the start of each session while the class is still assembled, rather than reconstructing it afterward.
- Use Excused for documented absences rather than leaving the cell blank. An empty cell and an excused absence are treated differently in reports.
- Review the previous session before class to catch any cells you may have left unmarked.
- Communicate your policy clearly: Let students know how attendance is tracked and what each status means, so there are no surprises when they view their records.